Personal Safety Ecosystem
The Product
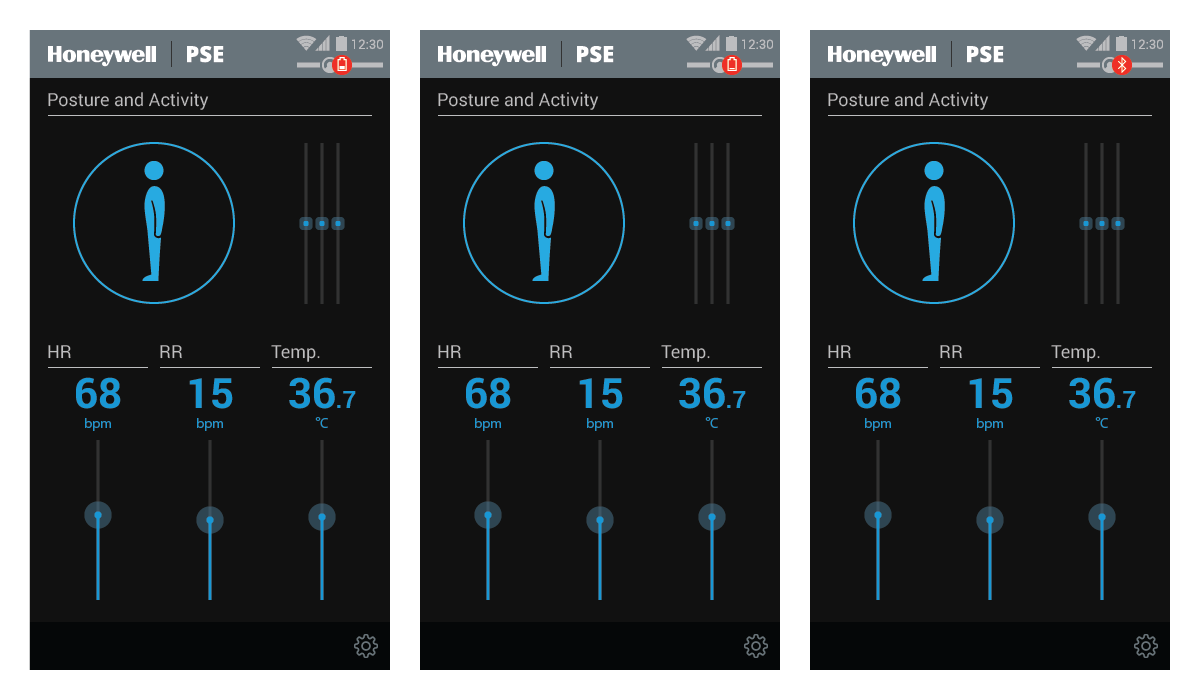
The Personal Safety Ecosystem (PSE) application captures an individual’s heart and respiratory rates, core temperature, posture, and motion data from a wearable sensor and shows the data in real time on an Android-OS based mobile application available to the individual. It also displays the physiological information of multiple sensor wearers in real time to a remote observer via a Windows-OS PC interface.
A typical scenario is an inherently dangerous work environment. In a disaster recovery situation PSE allows an attendant, such as a medical officer, to monitor vital signs and movements of the entrants, such as a response team, and to react quickly to anomalies before they turn hazardous.
The Project
The corporate-internal client wanted to demonstrate a working, ‘pre-Beta’ proof-of-concept to a key external customer within twelve to fifteen weeks, with the resultant deadline a foregone conclusion. With a fixed time constraint and a working-system deliverable the project owners were not open to a front loaded design process grounded in user research and testing even rudimentary prototypes. This context drove my approach, as described in the following.
For reasons unrelated to design or development, the project was not finished.
Design Challenges and Solutions
Accommodating the project’s time box as sole designer meant focusing on key data visualisation on a minimum viable product (MVP).
Mobile Application
Menu structures, value adjusters, dialogs, and the user flow for pairing a smartphones with a wearable sensor re-use existing Android OS assets, whereas collective data visualisation for the attendant occurs on a set of new frames integrated into existing software.
Vital Signs
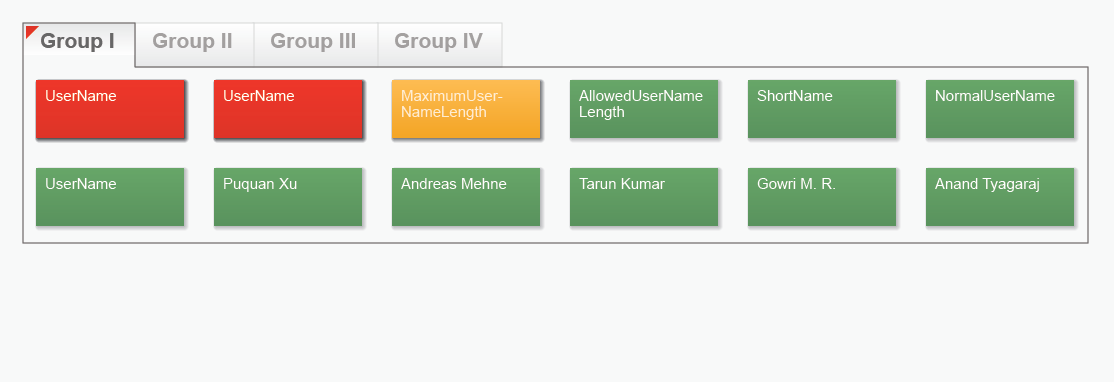
An individual’s heart and respiratory rate, as well as core temperature, should remain within a ‘green’ normal range but might enter ‘amber’ (warning) or ‘red’ (alarm) ranges on either side of the normal range. Using heart rate as example, the application distinguishes between bradycardia (heart rate dangerously low) and tachycardia (too high) warnings and alarms. The same principle applies to respiratory rate and core temperature measurements outside the safe limits.
Vital-signs data display next to one another in a three-column block:
- Numerals show a real-time value. If the attendant queries an entrant for his or her present respiratory rate, the answer is a simple number read-out.
- Linear-scale visualisation locates the real-time value to both bookends of the normal range, which can help indicate an up or down trend.
Accelerometer Data
The wearable sensor tracks posture and movement data, harder to interpret than vital signs, and harder to visualise meaningfully without complex 3D graphics.
To illustrate, appendix A (scroll to bottom) shows conventional modes of displaying data of this type – adequate to prove accuracy, but of questionable utility to an attendant who must decide quickly on intervention. The diagram in appendix B expresses force using a classic vector-in-spherical-space scheme.
For best decision support posture and acceleration data are best presented in context, and on a need-to-know basis.
Walking or running produces moderate g-force signatures along the x, y, and z-axes, at an upright or forward-leaning stance (appendix C). The exact pattern will differ amongst individuals due to weight, size, and other factors, but with the right algorithms the application can be ‘taught’ to interpret a given pattern as normal forward motion at specific cadences, and therefore no cause for alarm.
Rescue workers may assume odd postures when searching for earthquake survivors. They may crawl on all fours to check tight spots covered with debris. The application would indicate a pronounced forward lean accompanied by constant movement – quite normal under the circumstances. And quite distinct from an individual lying down flat and motionless, perhaps with low heart and respiratory rates, a clear cause for concern.
What may matter to the attendant then are deviations from normal patterns:
- Running at a certain pace is normal on a treadmill but becomes an accident risk when carrying heavy gear.
- A person lying flat may be at no risk if heart and respiratory rates remain ‘in tune’ with an activity for which this posture is normal.
- However a sudden forward topple followed by a sharp frontal deceleration after a running cadence strongly hints at a fall, to which the attendant may react with a simple call “Are you OK?” to the person concerned or an nearby individual via walkie-talkie.
Wireframes
Sequence for logging in, creating a new user profile and modifying user-specific settings
PC Application - Collective Data
The PC interface allows the attendant to track the physiological status of groups of people. Unlike the mobile app (for one individual alone) this system needs scalability.
PC Application - Individual Data
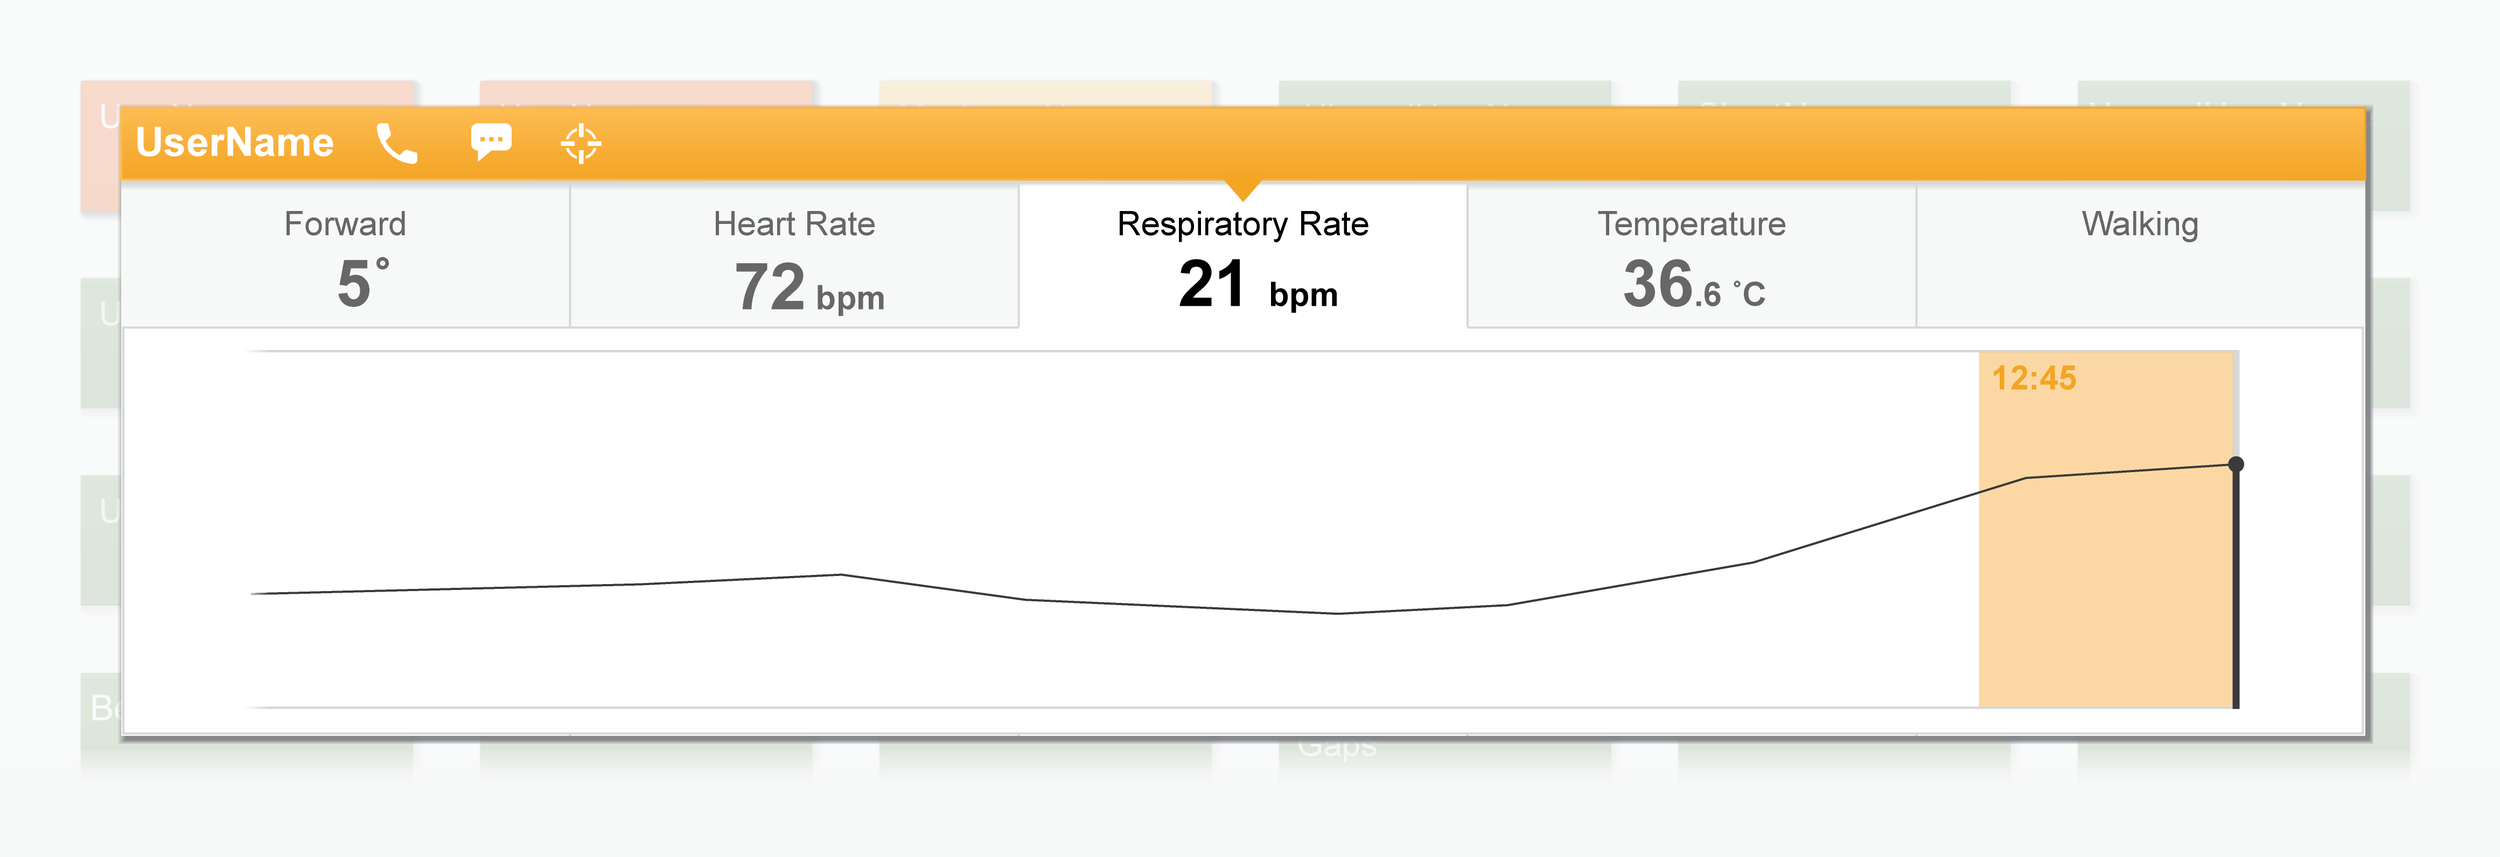
The attendant can drill down to status detail level on any worker. When selecting a specific data category of interest, the attendant can view a recent-history graph. The warning or alarm condition may have just subsided, but a spike or trough in a particular reading category remains legible.
Appendix


